
Performance Objective
Our objective is to outperform the S&P 500 Total Return Index long-term with lower volatility risk and by so doing to preserve and grow our client’s capital.
Since inception in 1987, to December 31, 2023; our SELECT 40TR Index (40 U.S. Large-Cap stocks) Strategy grew a hypothetical $10,000 to $465,900 as compared to $362,533 for the S&P 500TR with a Sharpe Ratio of 0.64 as compared to 0.48 for the S&P 500TR.
The SELECT 40TR Index portfolios have outperformed because the Strategy has a strong defense (downside protection in down markets) and a solid offense (upside gain in up markets). Portfolio audited hypothetical performance has consistently exceeded the benchmark in down markets. Since 2000 the market suffered four severe losses: 2000, 2001, 2002, and 2008 with an average annual loss of -20.0% for the S&P 500TR as compared the SELECT 40TR Index average annual gain of 0.16% for the same years. The mathematics of a strong defense and a solid offense build wealth over market cycles. For example, in 2008 the S&P 500TR loss was -37.0% and the SELECT 40TR Index -13.8%. In 2009, the S&P 500 TR gained 26.5% and the SELECT 40TR Index 23.5%. At the end of the 2008-2009 market cycle the SELECT 40TR Index portfolio value was 33.6% greater than the S&P 500TR portfolio value. As the market cycles the SELECT 40TR Index Strategy builds wealth with lower volatility risk.
Compound Annual Return SELECT 40 (Net) vs. S&P 500TR

Years Ending December 2023
SELECT 40TR Return & Risk Statistics
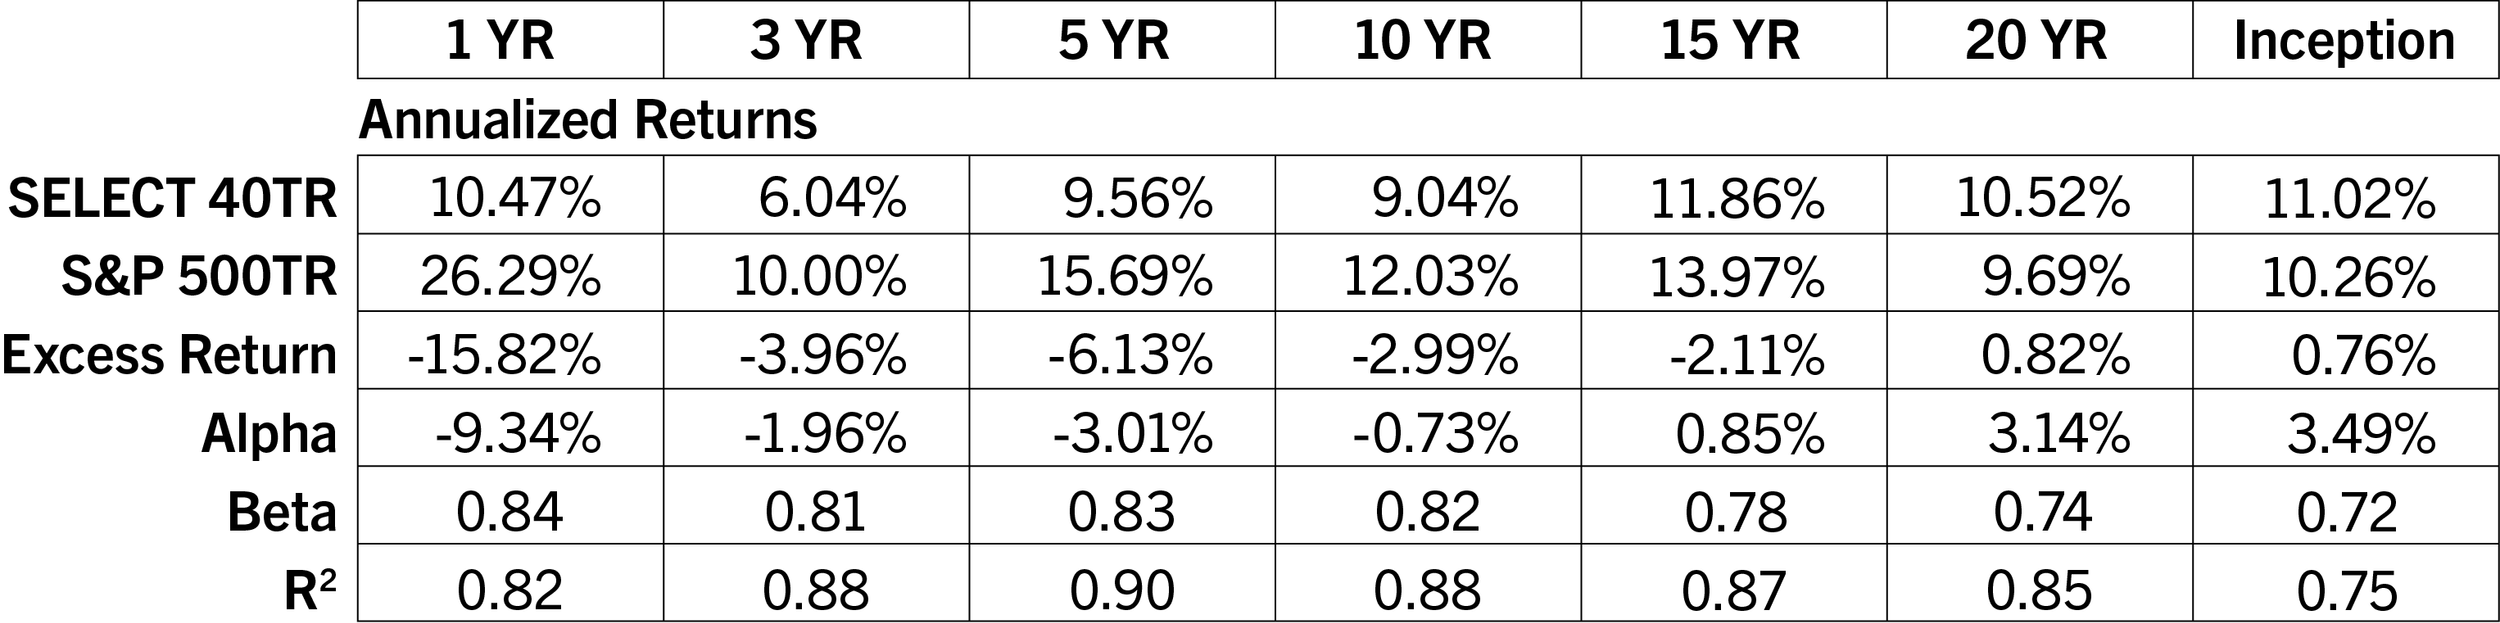
Years Ending December 2023
Sharpe Ratio SELECT 40TR (Net) vs. S&P 500TR
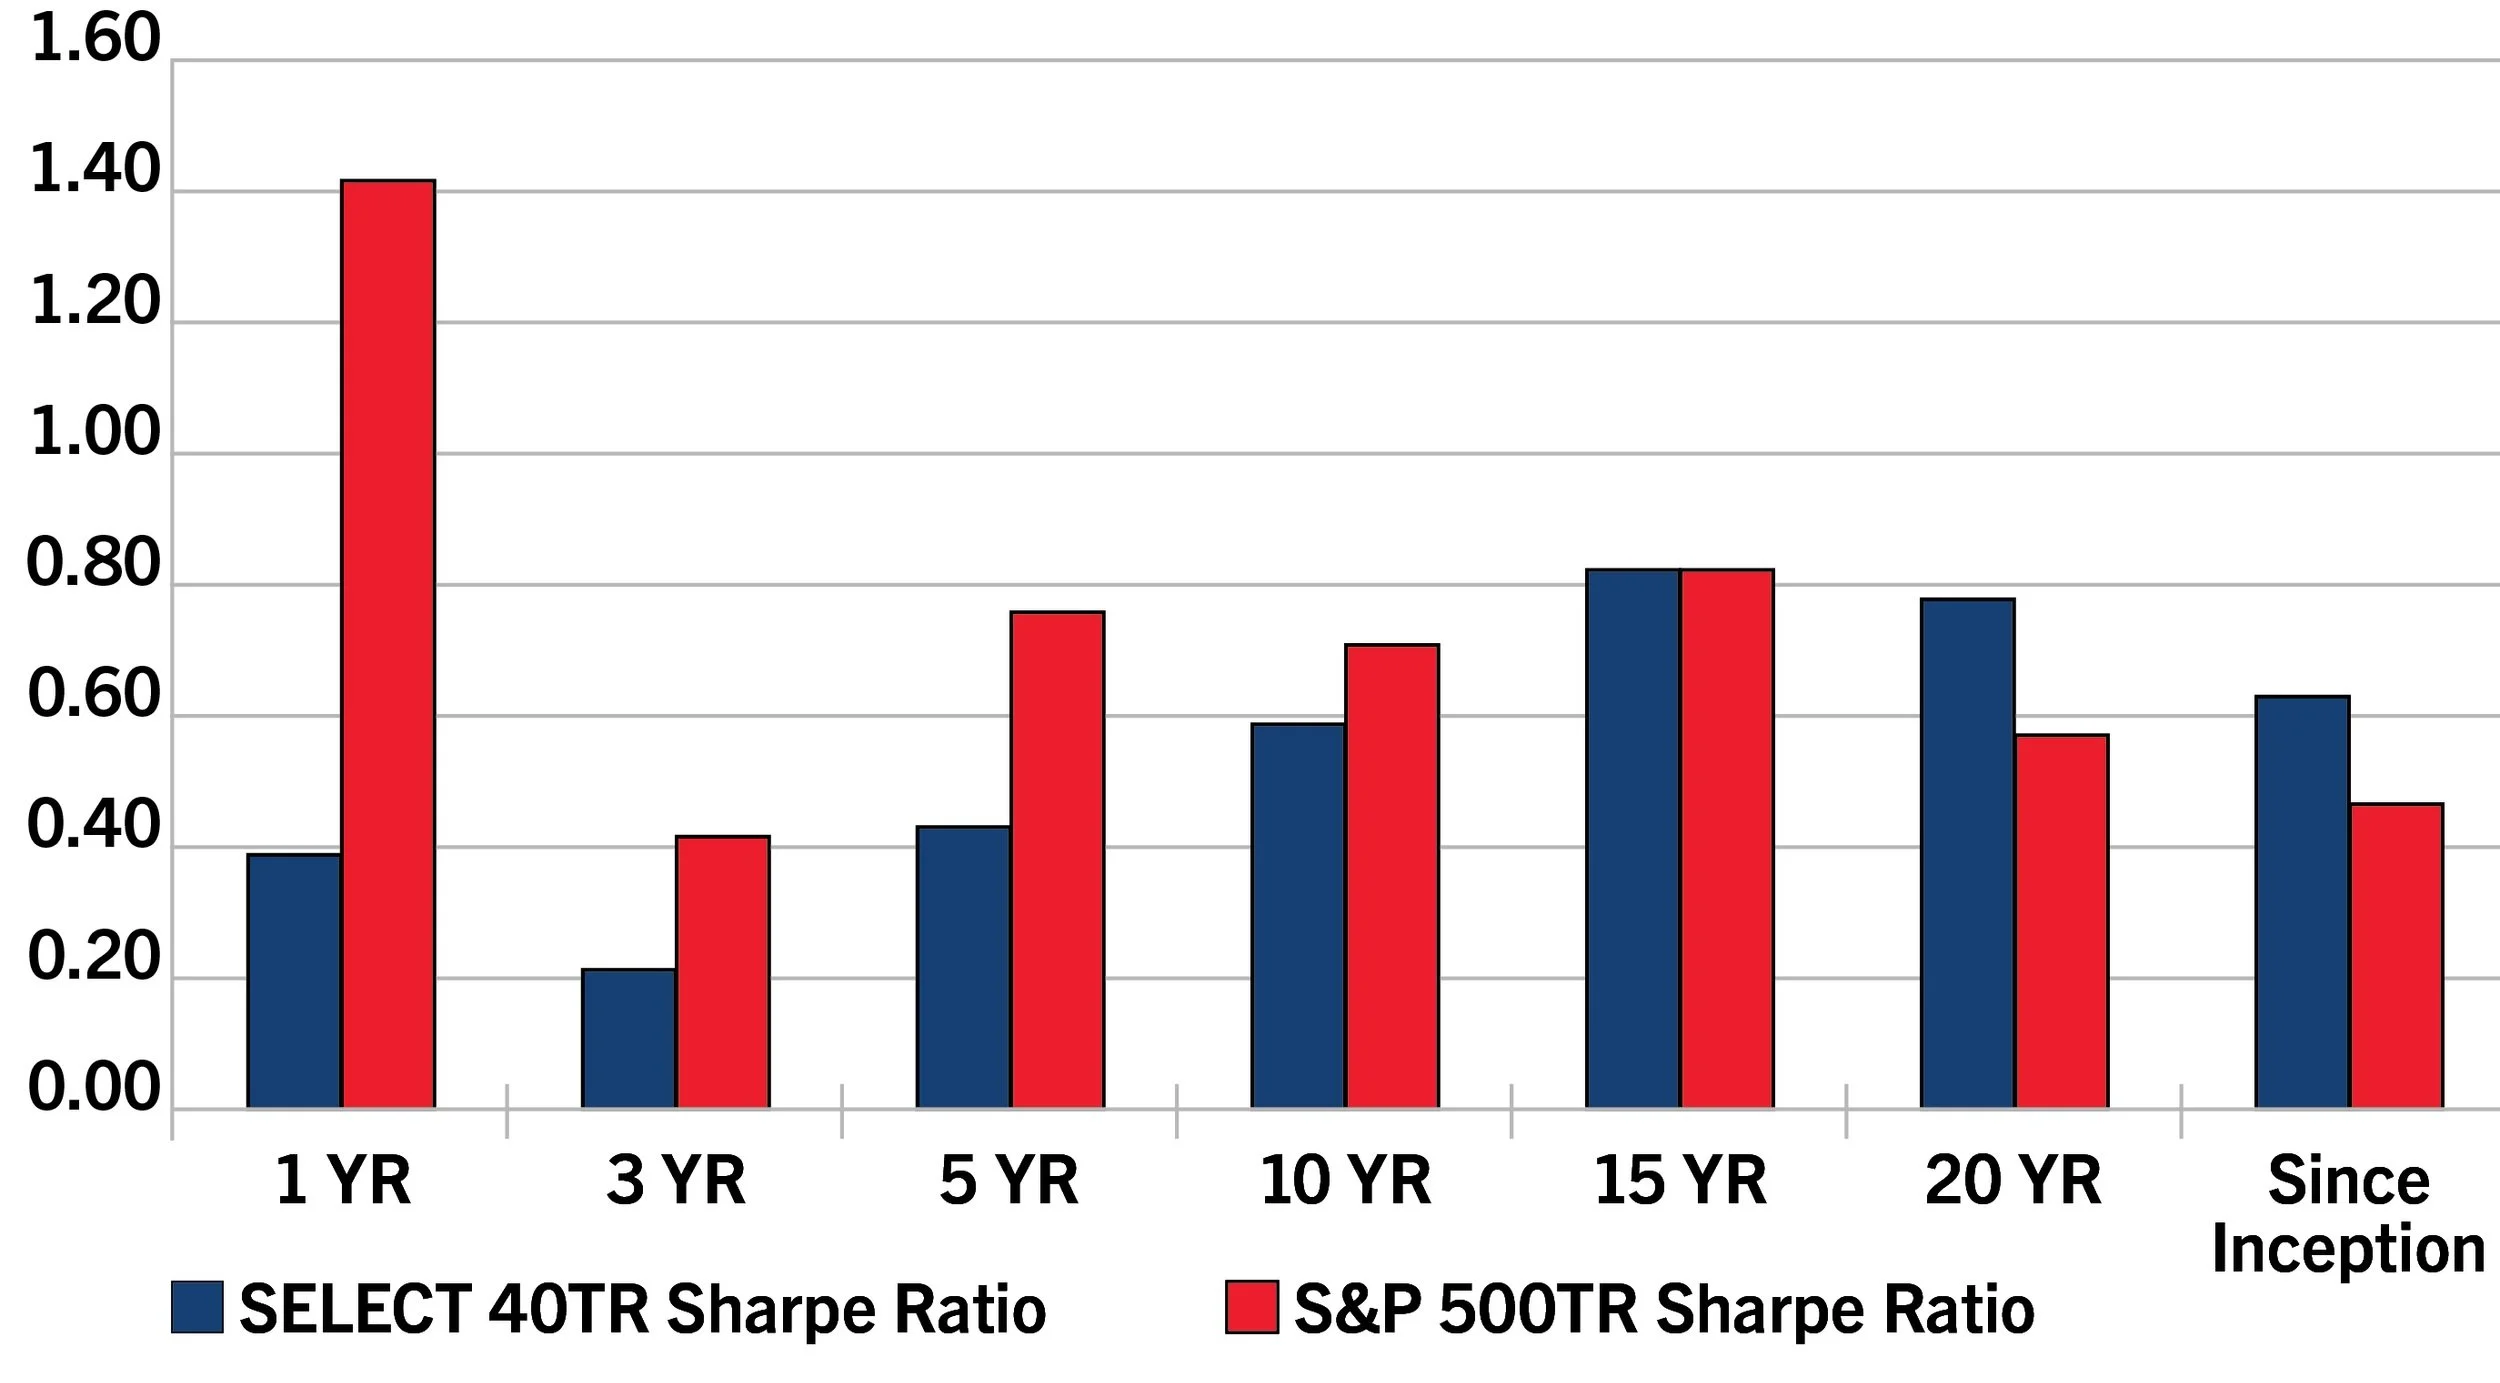
Years Ending December 2023
SELECT 40TR vs. S&P 500 TR Return Sharpe Ratio

Years Ending December 2023
SELECT 40TR INDEX AUDITED HYPOTHETICAL RETURNS ARE TOTAL RETURNS WITH DIVIDENDS REINVESTED
NET OF 1.21% MANAGEMENT FEE AND TRANSACTION COSTS
All investments contain risks and may lose value
PAST PERFORMANCE IS NOT A GUARANTEE OF FUTURE RETURNS